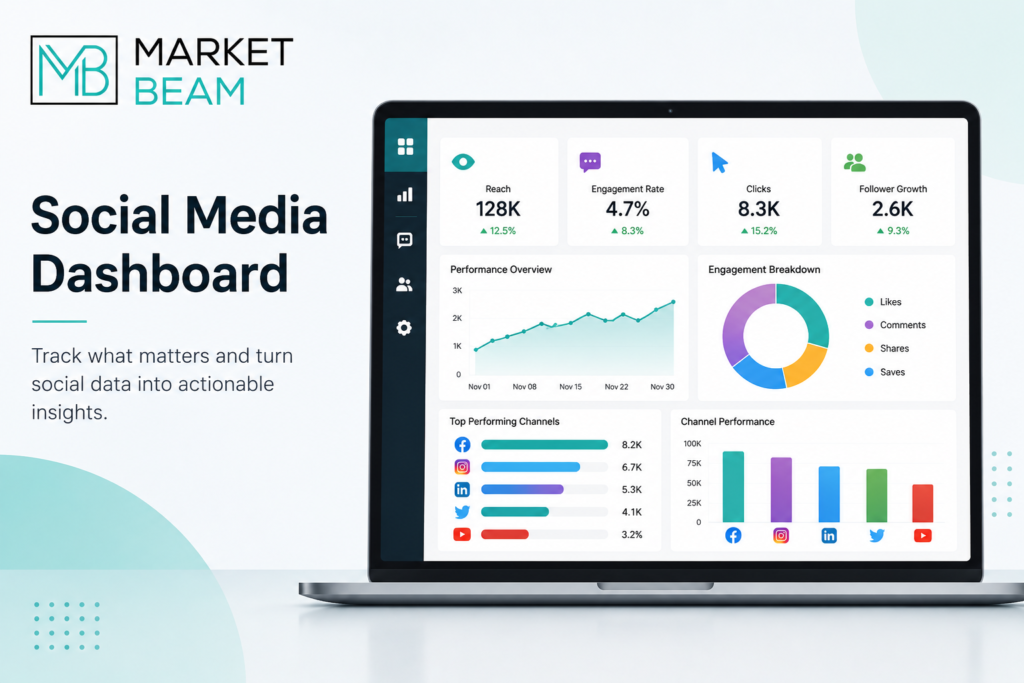
Enterprise social media teams generate enormous amounts of performance data every day. Reach, impressions, engagement, clicks, followers, conversions, and audience activity can all provide useful information, but reviewing these numbers across multiple platforms can quickly become overwhelming. A centralized social media dashboard helps teams organize this information and turn scattered data into actionable insights.
A well-designed social media dashboard gives marketing teams a single view of performance across channels, campaigns, brands, and regions. Instead of manually combining reports from different platforms, organizations can monitor important trends, compare results, and identify areas requiring attention.
For enterprise organizations, dashboards are also useful for improving collaboration between marketing managers, executives, communications teams, and analytics specialists. In regulated industries, reporting may need to work alongside governance and compliance processes, making centralized visibility even more valuable.
MarketBeam provides enterprise social media management capabilities that bring publishing, engagement, analytics, listening, governance, and reporting together, helping organizations make faster and more informed decisions.
What Is a Social Media Dashboard?
A social media dashboard is a centralized interface that displays important social media performance data in an organized and easy-to-understand format. It allows teams to monitor multiple channels without manually opening individual platform reports.
A modern social media dashboard can display metrics such as reach, impressions, engagement rate, clicks, follower growth, video performance, conversions, and campaign results. Depending on the platform, it can also provide audience insights, sentiment information, publishing activity, and competitive intelligence.
The key advantage is context. Instead of seeing isolated numbers, marketing teams can compare channels, campaigns, time periods, and content types to understand what is driving performance.
For enterprise teams, a dashboard also creates a shared source of information. Marketing managers can review campaign details, while executives can access summarized performance trends without requiring separate reports from different teams.
Why Enterprises Need a Social Media Dashboard
Enterprise organizations may manage dozens of social accounts across different brands, regions, products, and departments. Without centralized reporting, performance data becomes fragmented and difficult to compare.
A social media dashboard simplifies this complexity by bringing information into one environment. Teams can quickly identify which channels are performing well, which campaigns require attention, and where audience engagement is changing.
Dashboards also improve reporting consistency. Instead of each regional team creating its own spreadsheet, organizations can establish standardized metrics and reporting structures.
This is particularly valuable for leadership. Executives typically need a concise overview of performance rather than hundreds of individual platform metrics. A well-designed social media dashboard can provide that high-level view while allowing users to drill down into campaign or channel details when necessary.
For regulated organizations, centralized dashboards can also improve governance visibility by connecting performance reporting with approved campaigns, publishing activity, and operational workflows.
What Should a Social Media Dashboard Track?
The right information depends on business objectives, but enterprise teams should generally monitor a balanced combination of awareness, engagement, traffic, conversion, and audience metrics.
Awareness metrics such as reach and impressions show how widely content is being distributed. Engagement metrics reveal how audiences interact with published content. Clicks and click-through rate provide insight into traffic generation, while conversions connect social activity to measurable business outcomes.
Audience growth can indicate whether a brand is successfully expanding its community, while video completion metrics can help evaluate the effectiveness of visual content.
The most valuable social media dashboard does not simply display every available metric. Instead, it prioritizes the measurements that support specific business decisions.
Marketing teams should therefore define their objectives before deciding what information belongs on the dashboard.
Analytics Dashboard and Channel Performance
An effective analytics dashboard allows organizations to compare channel performance across platforms.
Each social platform has different audience behaviors and content formats. A post that performs well on LinkedIn may not generate the same response on Instagram or Facebook. Comparing channels helps marketing leaders understand where specific content strategies are most effective.
A centralized analytics view also makes it easier to identify trends. For example, one platform may generate the highest engagement while another produces stronger website traffic.
The goal is not necessarily to determine which channel is universally “best.” Instead, teams should determine which channels perform best for specific objectives and audiences.
An analytics dashboard should make these comparisons simple through filters, date ranges, campaign views, and standardized metrics.
Social KPIs to Include
A social media dashboard should focus on the social KPIs that align with marketing goals.
For awareness campaigns, reach and impressions may be the primary indicators. Engagement campaigns may prioritize engagement rate, shares, comments, and saves. Traffic campaigns can focus on clicks and click-through rate, while lead-generation campaigns should emphasize conversions and qualified leads.
Organizations should also track metrics consistently across reporting periods so that changes can be identified over time.
Avoiding metric overload is important. Too many KPIs can make dashboards difficult to interpret and reduce their usefulness for decision-making.
The best approach is to establish a small set of primary KPIs supported by secondary metrics that explain performance changes.
Essential Metrics for a Social Media Dashboard
| Metric | What It Shows | Primary Use |
| Reach | Unique audience exposure | Awareness |
| Impressions | Total content displays | Visibility |
| Engagement Rate | Audience interaction | Engagement |
| Clicks | User actions on links | Traffic |
| Conversions | Desired business actions | Lead generation |
| Follower Growth | Audience expansion | Community growth |
| Video Completion | Content consumption | Video performance |
| Response Rate | Audience service effectiveness | Community management |
Common Dashboard Challenges
Building a social media dashboard can create challenges when organizations use data from multiple platforms.
One issue is inconsistent metric definitions. Different networks may calculate engagement, reach, and other indicators differently, making direct comparisons difficult.
Another challenge is data fragmentation. Enterprise teams may still rely on exported spreadsheets or separate reporting tools, creating additional manual work and increasing the risk of reporting errors.
Dashboard complexity can also become a problem. Adding too many charts or metrics may make information harder to understand, especially for executives who need concise insights.
Organizations should therefore focus on standardized definitions, clear objectives, and dashboards that prioritize action-oriented information.
A centralized platform can simplify these challenges by bringing reporting into a consistent enterprise environment.
Reporting Automation for Faster Enterprise Reporting
A successful social media dashboard should reduce the amount of manual reporting required from marketing teams. When organizations manage several brands and platforms, manually exporting data and preparing spreadsheets can consume significant time and increase the risk of reporting inconsistencies.
Reporting automation helps solve this problem by collecting performance information at defined intervals and presenting it through standardized dashboards and reports. Marketing teams can spend less time preparing data and more time interpreting what the numbers mean.
Automated reporting can also improve consistency across regions and departments. Instead of each team using different calculations or reporting formats, organizations can establish common definitions for their most important metrics.
For executives, this creates faster access to current performance information. For marketing managers, automated reports make it easier to identify trends and compare campaign results over time.
Building an Executive Dashboard
An executive dashboard should provide a concise view of the information leadership needs to evaluate social media performance.
Executives typically do not need a detailed list of every post or individual engagement action. They need to understand whether strategic objectives are being achieved, which channels are performing best, how campaigns are progressing, and where attention may be required.
A well-designed executive dashboard can display a focused set of social KPIs, campaign performance, audience growth, and important changes compared with previous periods.
The dashboard should also provide enough context to explain performance. For example, a sudden increase in engagement may be linked to a product launch, major announcement, or campaign, while a decline may indicate a change in audience behavior or content strategy.
The goal of an executive dashboard is to turn complex social data into information that supports faster strategic decisions.
Social Media Dashboards for Regulated Industries
Regulated organizations require additional controls around social media reporting. Healthcare, pharmaceutical, financial, and other regulated companies often need to maintain visibility into both marketing performance and governance processes.
A social media dashboard can help teams monitor performance while maintaining context around content approval, publishing activity, campaigns, and organizational controls.
For example, compliance teams may need to understand which campaigns were published, while marketing teams evaluate their performance. Leadership may want a consolidated view across business units without accessing individual operational records.
A governance-aware reporting approach helps regulated organizations maintain stronger oversight without making reporting unnecessarily complicated.
Analytics should complement existing compliance and review procedures rather than replace them. The dashboard provides visibility, while qualified teams remain responsible for compliance decisions.
Using Channel Performance to Improve Strategy
A central purpose of a social media dashboard is understanding channel performance.
Different platforms serve different audiences and marketing purposes. LinkedIn may perform strongly for professional thought leadership, while Instagram may generate greater interaction with visual campaigns. Another channel may deliver stronger traffic or conversion performance.
Comparing channel performance allows organizations to allocate resources more effectively. Teams can identify where specific content types perform best and decide whether a campaign should be adapted or redistributed.
Organizations should avoid comparing platforms using a single metric. Instead, channel evaluation should consider the objective of each platform, the target audience, and the relevant social KPIs.
Over time, this creates a more strategic approach to platform management.
Connecting Analytics With Social Listening
The strongest enterprise reporting systems do not analyze performance data in isolation. Combining dashboard data with social listening can provide a broader understanding of why performance changes.
For example, a campaign may experience unusually high engagement. Traditional analytics can identify the increase, while listening data may explain whether conversations are positive, negative, or driven by a specific event.
This connection between performance data and audience conversations creates deeper insights. Marketing teams can evaluate both what audiences did and what they said.
MarketBeam brings social media analytics, listening, engagement, publishing, and governance into a broader enterprise social media environment, helping teams connect operational and analytical information.
How MarketBeam Supports Social Media Reporting
MarketBeam helps enterprise organizations manage social media activities through a centralized environment that combines analytics, reporting, publishing, engagement, listening, and governance.
A centralized social media dashboard can provide marketing teams with greater visibility into campaign performance, channel activity, and important trends. Teams can use reporting to identify strong-performing content and areas that require optimization.
The broader MarketBeam platform also supports regulated organizations by connecting social media operations with governance and compliance workflows. This gives teams greater context when analyzing performance across campaigns and channels.
For leadership teams, centralized reporting can simplify executive dashboard requirements by bringing relevant metrics into a consistent environment rather than relying on separate reports from different departments.
By combining reporting automation, analytics, and enterprise social media management, MarketBeam helps organizations reduce manual reporting effort while making social data more useful for decision-making.
Dashboard Framework by Marketing Objective
| Marketing Objective | Primary Dashboard Metrics | Recommended View |
| Brand Awareness | Reach, impressions, audience growth | Executive summary |
| Engagement | Engagement rate, shares, comments | Campaign dashboard |
| Traffic | Clicks, CTR, landing-page visits | Channel comparison |
| Conversions | Leads, conversions, conversion rate | Performance dashboard |
| Community Management | Response rate, response time | Engagement view |
| Executive Reporting | Overall KPIs, trends, campaign results | Executive dashboard |
| Compliance Oversight | Approved content, publishing activity | Governance view |
Best Practices for Building a Social Media Dashboard
An effective social media dashboard should start with business objectives rather than available metrics. Define what the organization wants to achieve, then select the measurements required to evaluate progress.
Keep dashboards focused. A smaller group of relevant social KPIs is generally more useful than dozens of disconnected metrics.
Standardize definitions across departments so reach, engagement, conversions, and other measurements are calculated consistently.
Use reporting automation to reduce repetitive manual work, but maintain human analysis for important business decisions.
Finally, review dashboard requirements regularly. As campaigns, audiences, and business objectives change, the information teams need may change as well.
Conclusion
A well-designed social media dashboard gives enterprise teams a centralized view of social performance while reducing the complexity of managing multiple platforms and campaigns.
By combining an effective analytics dashboard, reliable channel performance reporting, automated reporting processes, focused social KPIs, and clear executive dashboard views, organizations can turn social media data into actionable business intelligence.
For regulated organizations, dashboards can also provide valuable visibility into social activity alongside governance and compliance processes.
MarketBeam brings analytics, reporting, publishing, listening, engagement, and governance together, helping enterprises build a more connected approach to social media performance management.
Connect With Us
Ready to improve your social media reporting and dashboard strategy?
Sales: sales@marketbeam.io
Tech Support: support@marketbeam.io
Connect with MarketBeam to explore enterprise social media analytics, reporting automation, governance, and centralized social media management.
Frequently Asked Questions
1. What is a social media dashboard?
A social media dashboard is a centralized interface that displays important social media performance information across platforms, campaigns, accounts, and business units.
2. What should an analytics dashboard include?
An analytics dashboard should include the metrics most closely connected to business objectives, such as reach, engagement rate, impressions, clicks, conversions, audience growth, and campaign performance.
3. Why is reporting automation useful?
Reporting automation reduces manual data collection and preparation, improves reporting consistency, and gives teams faster access to current performance information.
4. What is channel performance?
Channel performance measures how effectively different social media platforms contribute to specific marketing objectives. It helps organizations determine where content and budget are generating the strongest results.
5. What should an executive dashboard show?
An executive dashboard should focus on a concise set of strategic KPIs, campaign results, trends, audience growth, and important performance changes that support leadership decision-making.
6. How does MarketBeam support social media dashboards?
MarketBeam combines analytics, reporting, publishing, engagement, listening, governance, and workflow capabilities to help enterprise teams centralize performance information and improve social media decision-making.